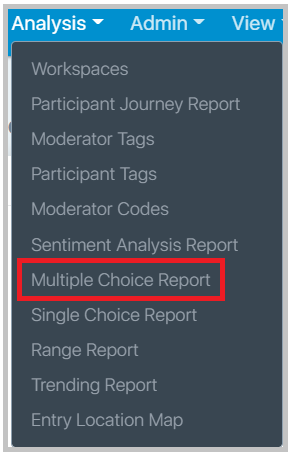
The Multiple Choice Report can be accessed through the Analysis dropdown within the top navigation.
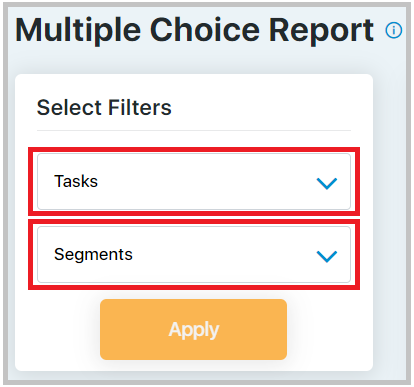
The multiple-choice report displays participant responses to multi-choice questions one task at a time. You can switch between multi-choice tasks using the ‘Tasks’ filter drop-down menu on the left-hand side of the page. You can use this filter in combination with the ‘Segments’ filter.
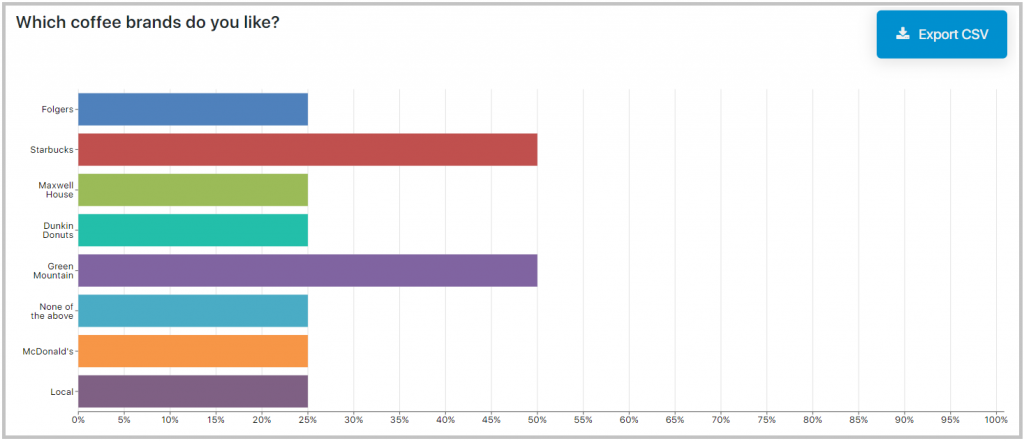
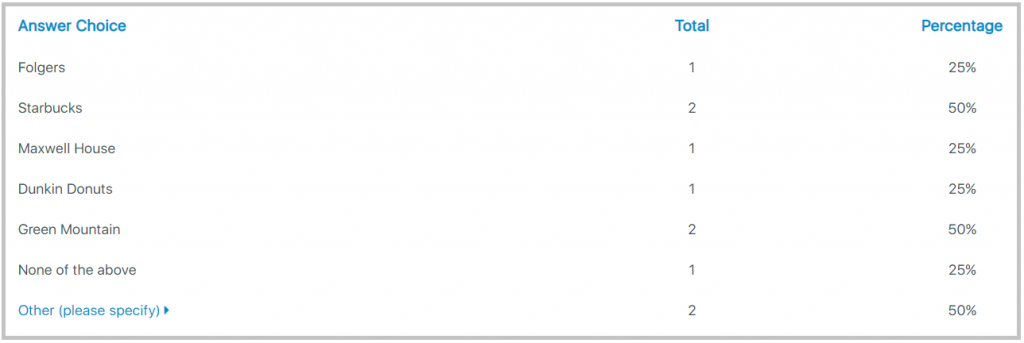
The bar graph depicts the percentage of people who selected that particular option, and when you hover over a bar, it will display the underlying counts/percentages. Below the graph, the data is populated in a table format.
The percentage for each individual option is calculated by dividing each answered option count by the total number of unique respondents who answered that multi-question. Then, to get the percentage, the quotient is multiplied by 100.
For example, if the total number of unique respondents who answered the question is 15 and 10 out of those answered option 1, then the calculation is as follows:
10/15 = 0.6667
0.6667 x 100 = 66.67
% of Respondents who selected option 1: 66.67%
On the top right hand of the screen, you will see an Export CSV button that, if clicked, will download a CSV file of the data.
Note: In both the bar graph and the table, the ‘None of the above’ option will come at the end of the normal answer choices. Below that, you will find the other specify text (if someone selected other specify as the answer choice and added a text of their choice).