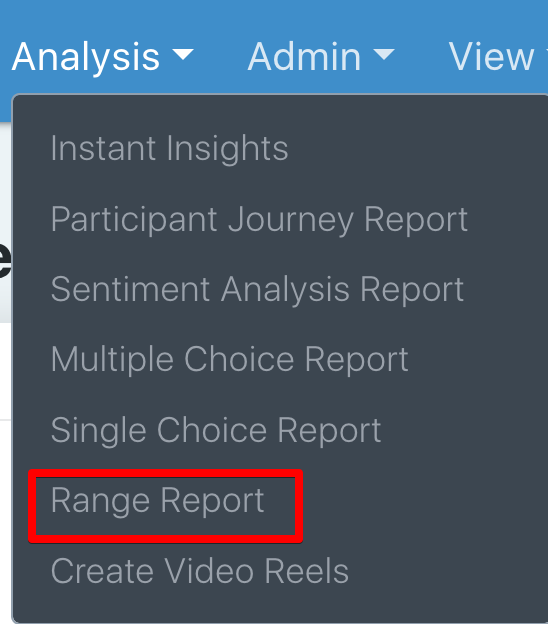
The range report can be accessed through the Analysis dropdown within the top navigation.
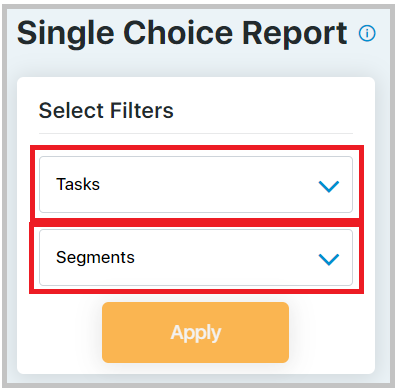
The range report displays participant responses to range questions one task at a time. You can switch between range tasks using the ‘Tasks’ filter drop-down menu on the left-hand side of the page. You can use this filter in combination with the ‘Segments’ filter.
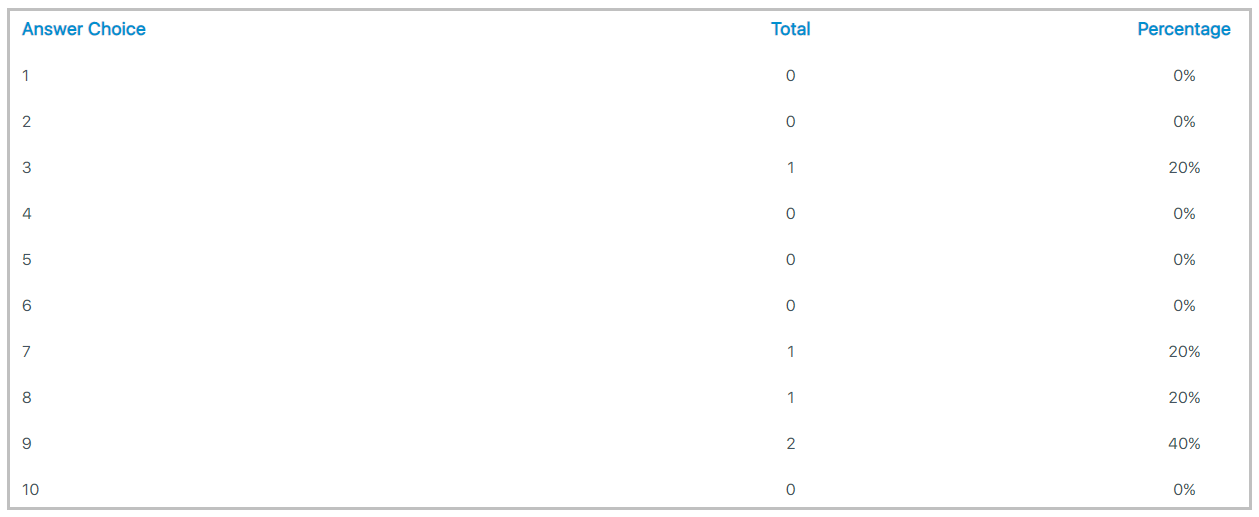
The bar graph depicts the percentage of people that selected each answer option, and when you hover over a bar, it will display the underlying counts/percentages. Below the graph, you will see the data populated in a table format. On the top right hand of the screen, you will see an Export CSV button that, if clicked, will download a CSV file of the data.